
OVERVIEW OF SB-50
Updated April 10, 2019
California Senate Bill 50 (SB-50) is designed to incentivize higher density housing development near major transit stops, major bus routes, and in “areas of high-opportunity close to jobs” throughout California. The Bill requires local governments to grant “equitable communities incentives” waiving certain local zoning rules for housing projects that include a minimum number of affordable units.1 It applies to all cities, including charter cities. This page summarizes the possible impacts of the Bill on Palo Alto. The City of San Francisco has completed a similar analysis for San Francisco that can be viewed here.
If passed, SB-50 would allow townhouses and apartment buildings to be developed on properties throughout Palo Alto, effectively eliminating R-1 single family zoning city-wide.2 It would also limit the City’s ability to set height, building density, parking and a variety of other development standards.
Disclaimer: This analysis was commissioned with the intention of educating and informing citizens. We believe informed and involved citizens are the bedrock of good government. The following analysis is based on the December 3, 2018 version of SB-50 was updated to reflect amendments proposed on March 11, 2019. The text will be updated if the Bill is amended again in the future.

AFFECTED AREAS
The bill targets three critical zones that will be subject to varying degrees of upzoning – Jobs-Rich, Transit-Rich, and High Quality Bus Corridors. The Jobs-Rich zone is defined by an area’s proximity to jobs, school quality and median income. The last two zones are defined by proximity to transit.
“Jobs-Rich”
Jobs-Rich areas are Census tracts that are identified by the California Department of Housing and Community Development to have both high education and economic opportunities, as well as higher employement densities. Specific jobs-rich tracts have not yet been identified by the State. However, Palo Alto, under will likely reach that threshold. Few cities boast a jobs to housing ratio of almost 3:1, an area median income almost twice the state median, and a school district where over 75% of students test “at or above” state standards.3 As such, SB-50 will likely impact all of Palo Alto including neighborhoods far from transit such as Crescent Park, Duveneck, Midtown and Fairmeadow.
“Transit-Rich”
The Bill affects all of Palo Alto, but has particular significance for parcels that fall within a 1⁄2 mile radius of three Caltrain stops:
- Palo Alto Station – parts of Downtown North, University South, Professorville
- California Ave. Station – parts of Old Palo Alto, Midtown, Evergreen Park, Mayfield, Ventura
- San Antonio Station – parts of Greenmeadow and Monroe Park
“High Quality Bus Corridor”4
There are also three primary transit routes that qualify as High-Quality Bus Corridors. This designation includes areas that are within ¼ mile of bus routes that have service intervals of no more than 15 minutes during peak weekday hours. Bus routes that qualify as a High-Quality Bus Corridor include:
- VTA Rte 22 & 522 – Evergreen Park, South- gate, College Terrace, Barron Park, Ventura
- SamTrans Route 281 (University Ave.) – Downtown North

Map of Affected Areas (click to enlarge)
DEVELOPER INCENTIVES
Projects in either Jobs-Rich or High-Quality Bus Corridor areas must be granted the Base Incentives described below. Projects that are ALSO within a half mile radius of a major transit stop (i.e., train station), are entitled to the Base Incentives plus the Secondary Incentives described here.
BASE INCENTIVES
Because all of Palo Alto likely qualifies as Jobs-Rich under SB-50, residential projects throughout the City that include the minimum number of affordable units, would be:
- Exempt from local density controls on housing.
- Eligible for reduced parking requirements.
- Allowed up to three additional incentives/concessions related to such things as height, floor area, setbacks or daylight plane requirements, to be chosen by the developer.
In communities/cities that are not deemed Jobs-Rich, the base incentives apply only to properties within a High-Quality Bus Corridor.
SECONDARY INCENTIVES
In addition to the Base Incentives, projects that fall within a 1⁄2 mile of the Caltrain stations – Palo Alto, California Ave and San Antonio, would be:
- Entitled to build to a height of at least 45 feet if within a ½ mile radius of the station, and to a height of at least 55 feet if within a ¼ mile radius.
- Allowed to build floor area up to 2.5 times the size of the lot (Floor Area Ratio) within the 1⁄2 mile radius and 3.25 times the size of the lot within the 1⁄4 mile radius.
- Exempt from any on-site parking requirements.

Rendering of Possible Development in Palo Alto.
POSSIBLE IMPACTS
SINGLE-FAMILY NEIGHBORHOODS
Existing single-family neighborhoods could be significantly altered by SB-50’s development incentives that relate to height, density, parking and setbacks. With reduced or no parking requirements, the streets could fill up with more parked cars on both sides leaving a narrow passage lane for cars, bikes and pedestrians. Overall, approximately 7,000 parcels in Palo Alto lie in either the Transit Rich or High-Quality Bus Corridor. This represents about 40% of the approximately 18,000 parcels in the city, and does not even include those parcels in Jobs-Rich areas. SB-50 could result in a complete shift from today’s detached single-family housing development pattern to a townhouse and apartment development pattern.
SCHOOLS
SB-50 has no school funding formula. The economics of basic aid school districts like Palo Alto’s are directly impacted by new housing development. They are dependent on local property taxes as a major source of revenue. And while new development brings in additional property tax, it generally brings in additional students. The student generation rate for housing can greatly affect the break-even economics for schools in basic aid districts. To date, Palo Alto has been fortunate to operate public schools with higher-than-state-average per-pupil expenditures, but depending on the type and number of housing units built, that per-pupil spending could fall.
PARKING
Given the combination of more housing density with zero parking requirement for Transit-Rich developments and reduced parking requirement for developments throughout the rest of the city, it is reasonable to assume the surfeit of additional cars will be parked on the streets. According to Hedges & Company, car registrations per capita in Palo Alto has climbed 12 percent over the last five years. This reflects car ownership trends across the Bay Area and in other parts of California.5,6
ROAD SAFETY
More curb-parked cars reduces visibility, contributing to pedestrian, bicycle and car collisions. In Santa Clara County, Palo Alto already has the dubious distinction of the highest per capita vehicle-bicycle and vehicle-pedestrian collisions.7
TRANSIT
It would be great if everyone who lived and worked close to transit used it. However, a recent study out of UCLA’s Institute of Transportation Studies found that the “defining attribute of regular transit riders is their relative lack of private vehicle access” not proximity to transit.6 Perhaps it is not surprising then that while the Bay Area has experienced sustained growth in vehicle ownership, the Valley Transit Authority has reported a decline in bus ridership, and Palo Alto’s share of Caltrain ridership has plateaued.5,8 9
More importantly only a small percentage of commuters arrive and leave Palo Alto each day by train. During the weekday AM Peak approximately 5,300 of the city’s 100,000 strong workforce arrive on Caltrain (1,368 of those 5,300 work at Stanford).10,11,12 Conversely, an even smaller number of Palo Alto residents who work outside the city use Caltrain in the AM Peak – 1,200 out of a possible 22,000 workers.10,13 Outbound and inbound that represents around 5% of commuters.
A contributing factor may be that more than a quarter of the trains are at or above 95% capacity.14 Caltrain estimates that its current electrification project will increase capacity by 21% by 2040,15 however more than half of that additional capacity is spoken for by Stanford’s planned expansion.12

Table of proposed zoning changes.
THE NUMBERS
The table to the right shows the maximum number of units that could be theoretically constructed in the Transit-Rich and High Quality Bus Corridor areas. It does not take into account additional housing that could be constructed in the remaining Jobs-Rich areas.
These calculations assume that future development would take advantage of the generous Floor Area Ratios (FARs) and maximum building heights allowed by SB-50. It does not count additional units resulting from a developer’s selection of up to three additional Density Bonus concessions. If all eligible properties were to take advantage of SB-50’s development incentives, a conservative estimate suggests that approximately 58,000 housing units could be built. That is an almost four-fold increase in housing compared to the approximately 12,500 housing units that exist in Transit-Rich and High Quality Bus Corridors areas today. City-wide, it would more than double the number of housing units.
Overall, SB-50 could add an additional 46,000 units in Transit-Rich and High Quality Bus Corridor areas. This would almost triple Palo Alto’s population and conservatively add 90,000 vehicles and 30,000 school-age children.8 The question remains as to where investment dollars will come from to support the new transportation, education and community services needed to support this growth.
Table of possible impacts on density and number of units.
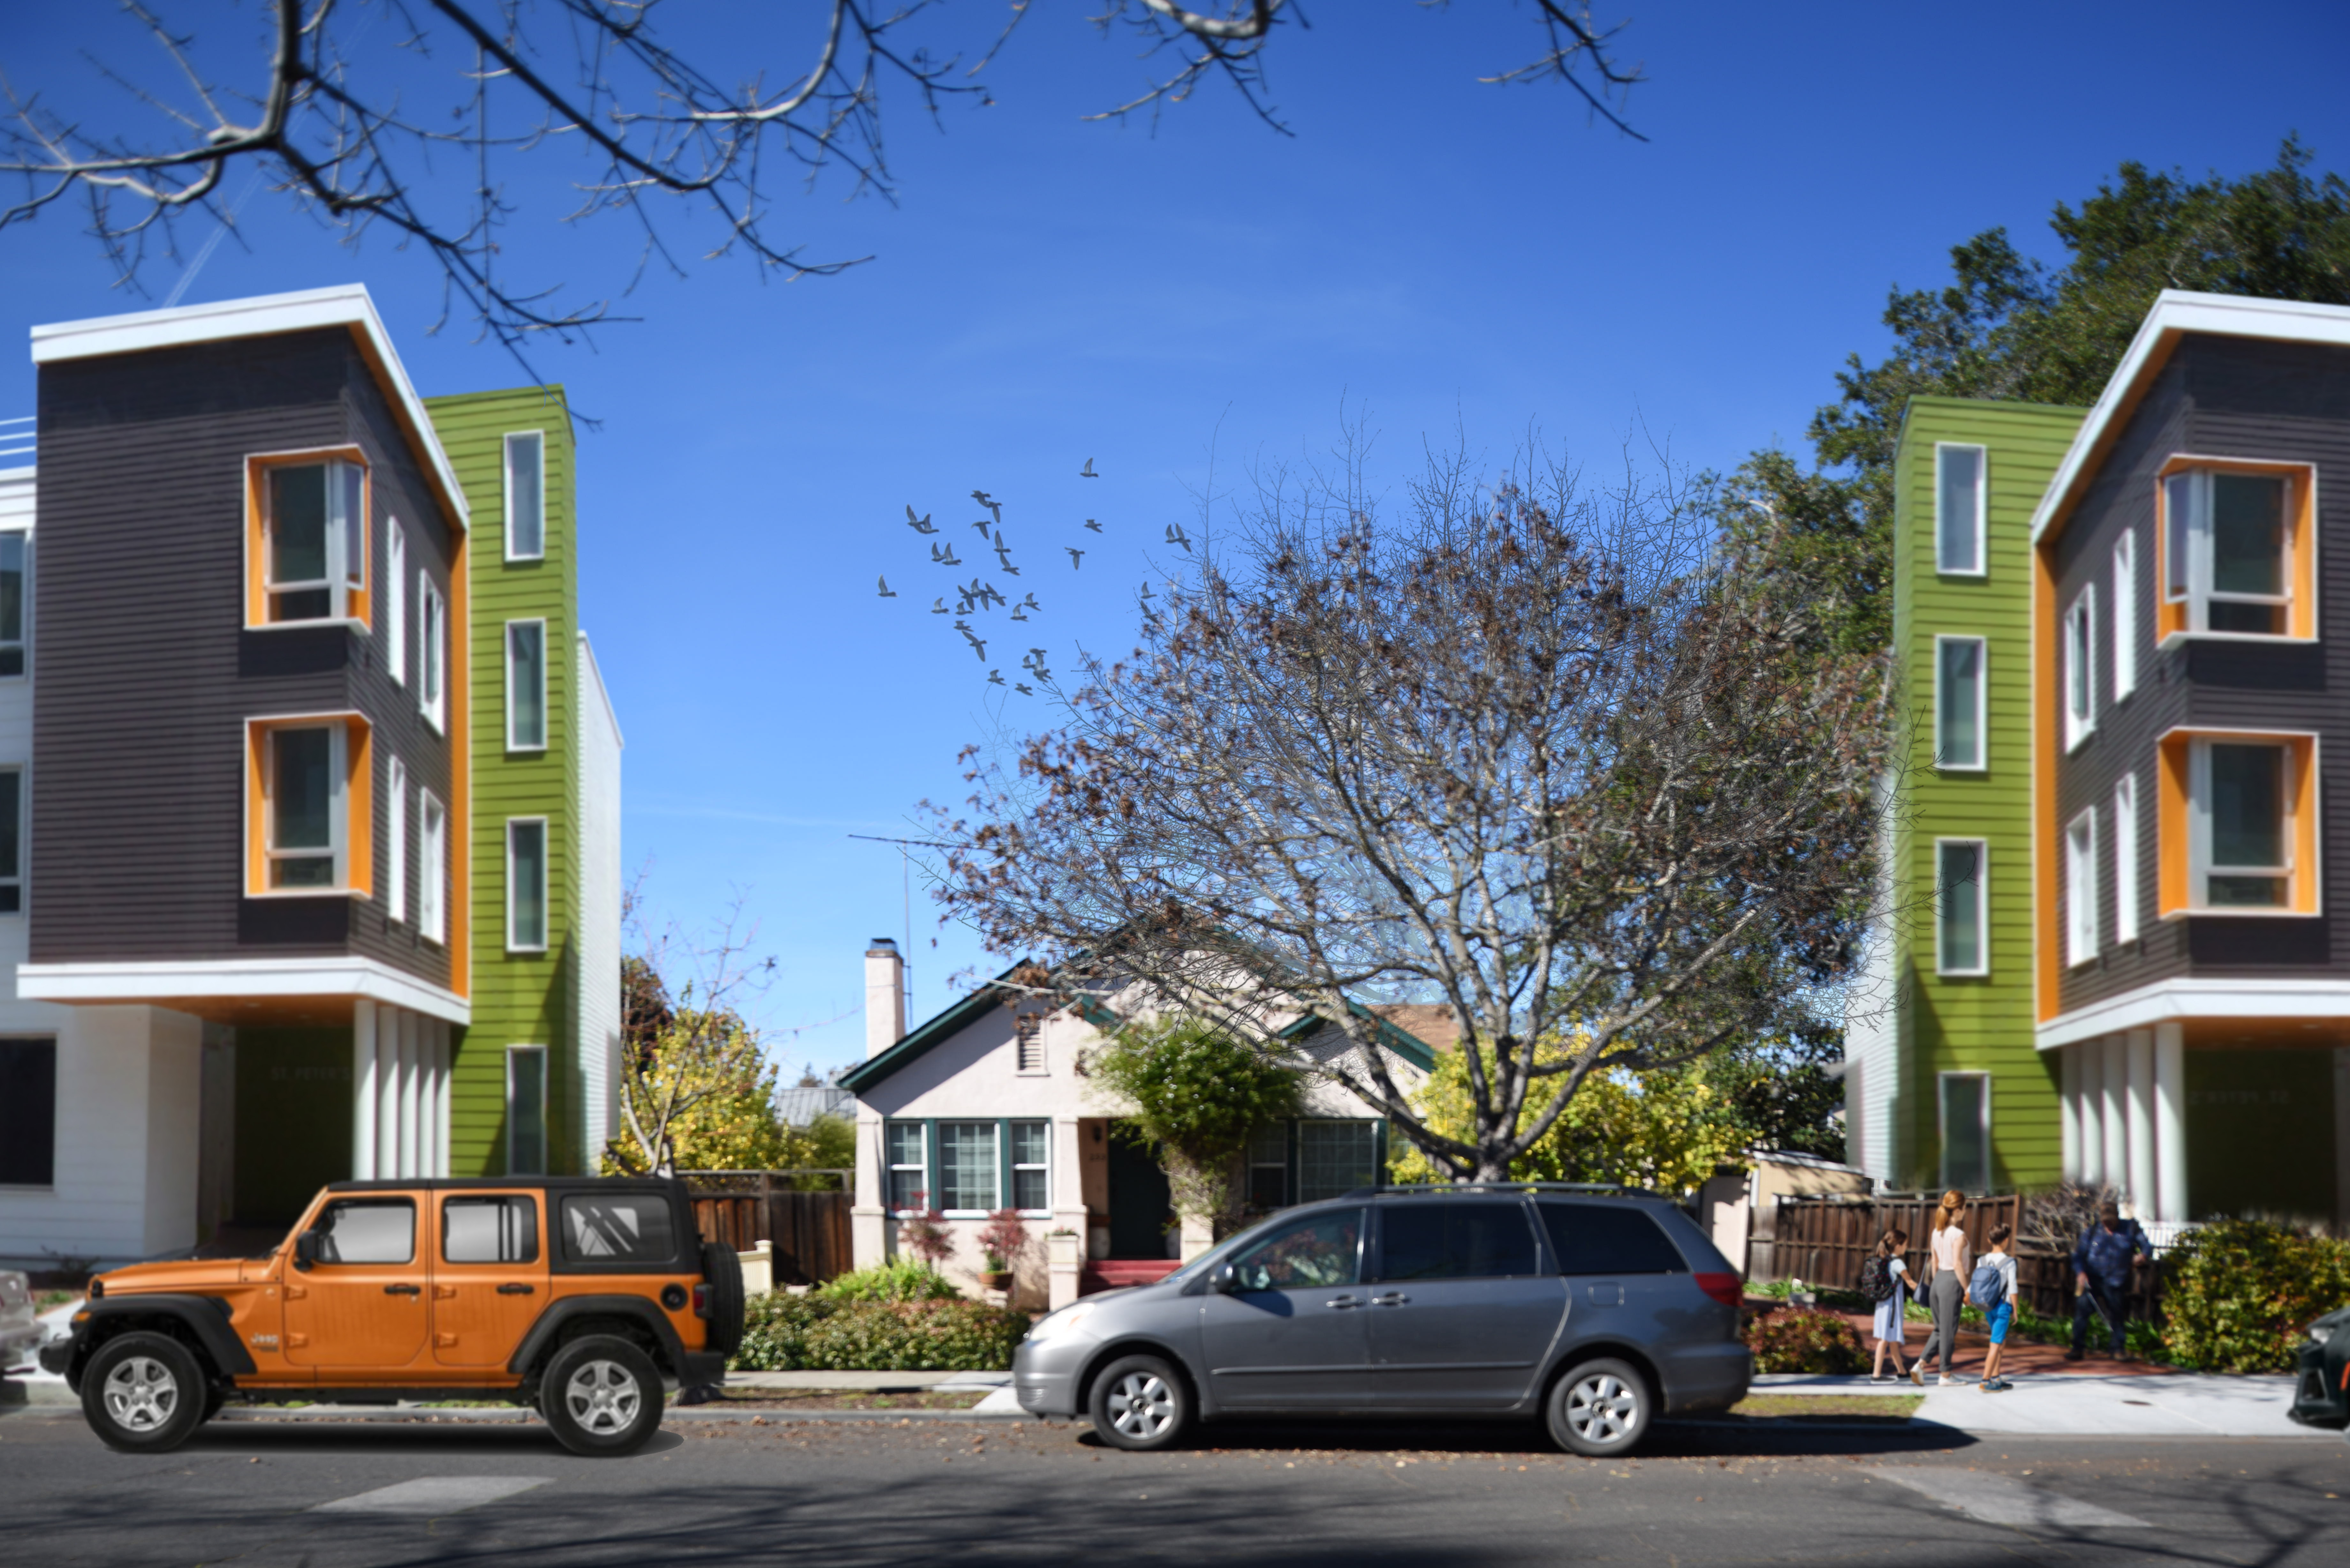
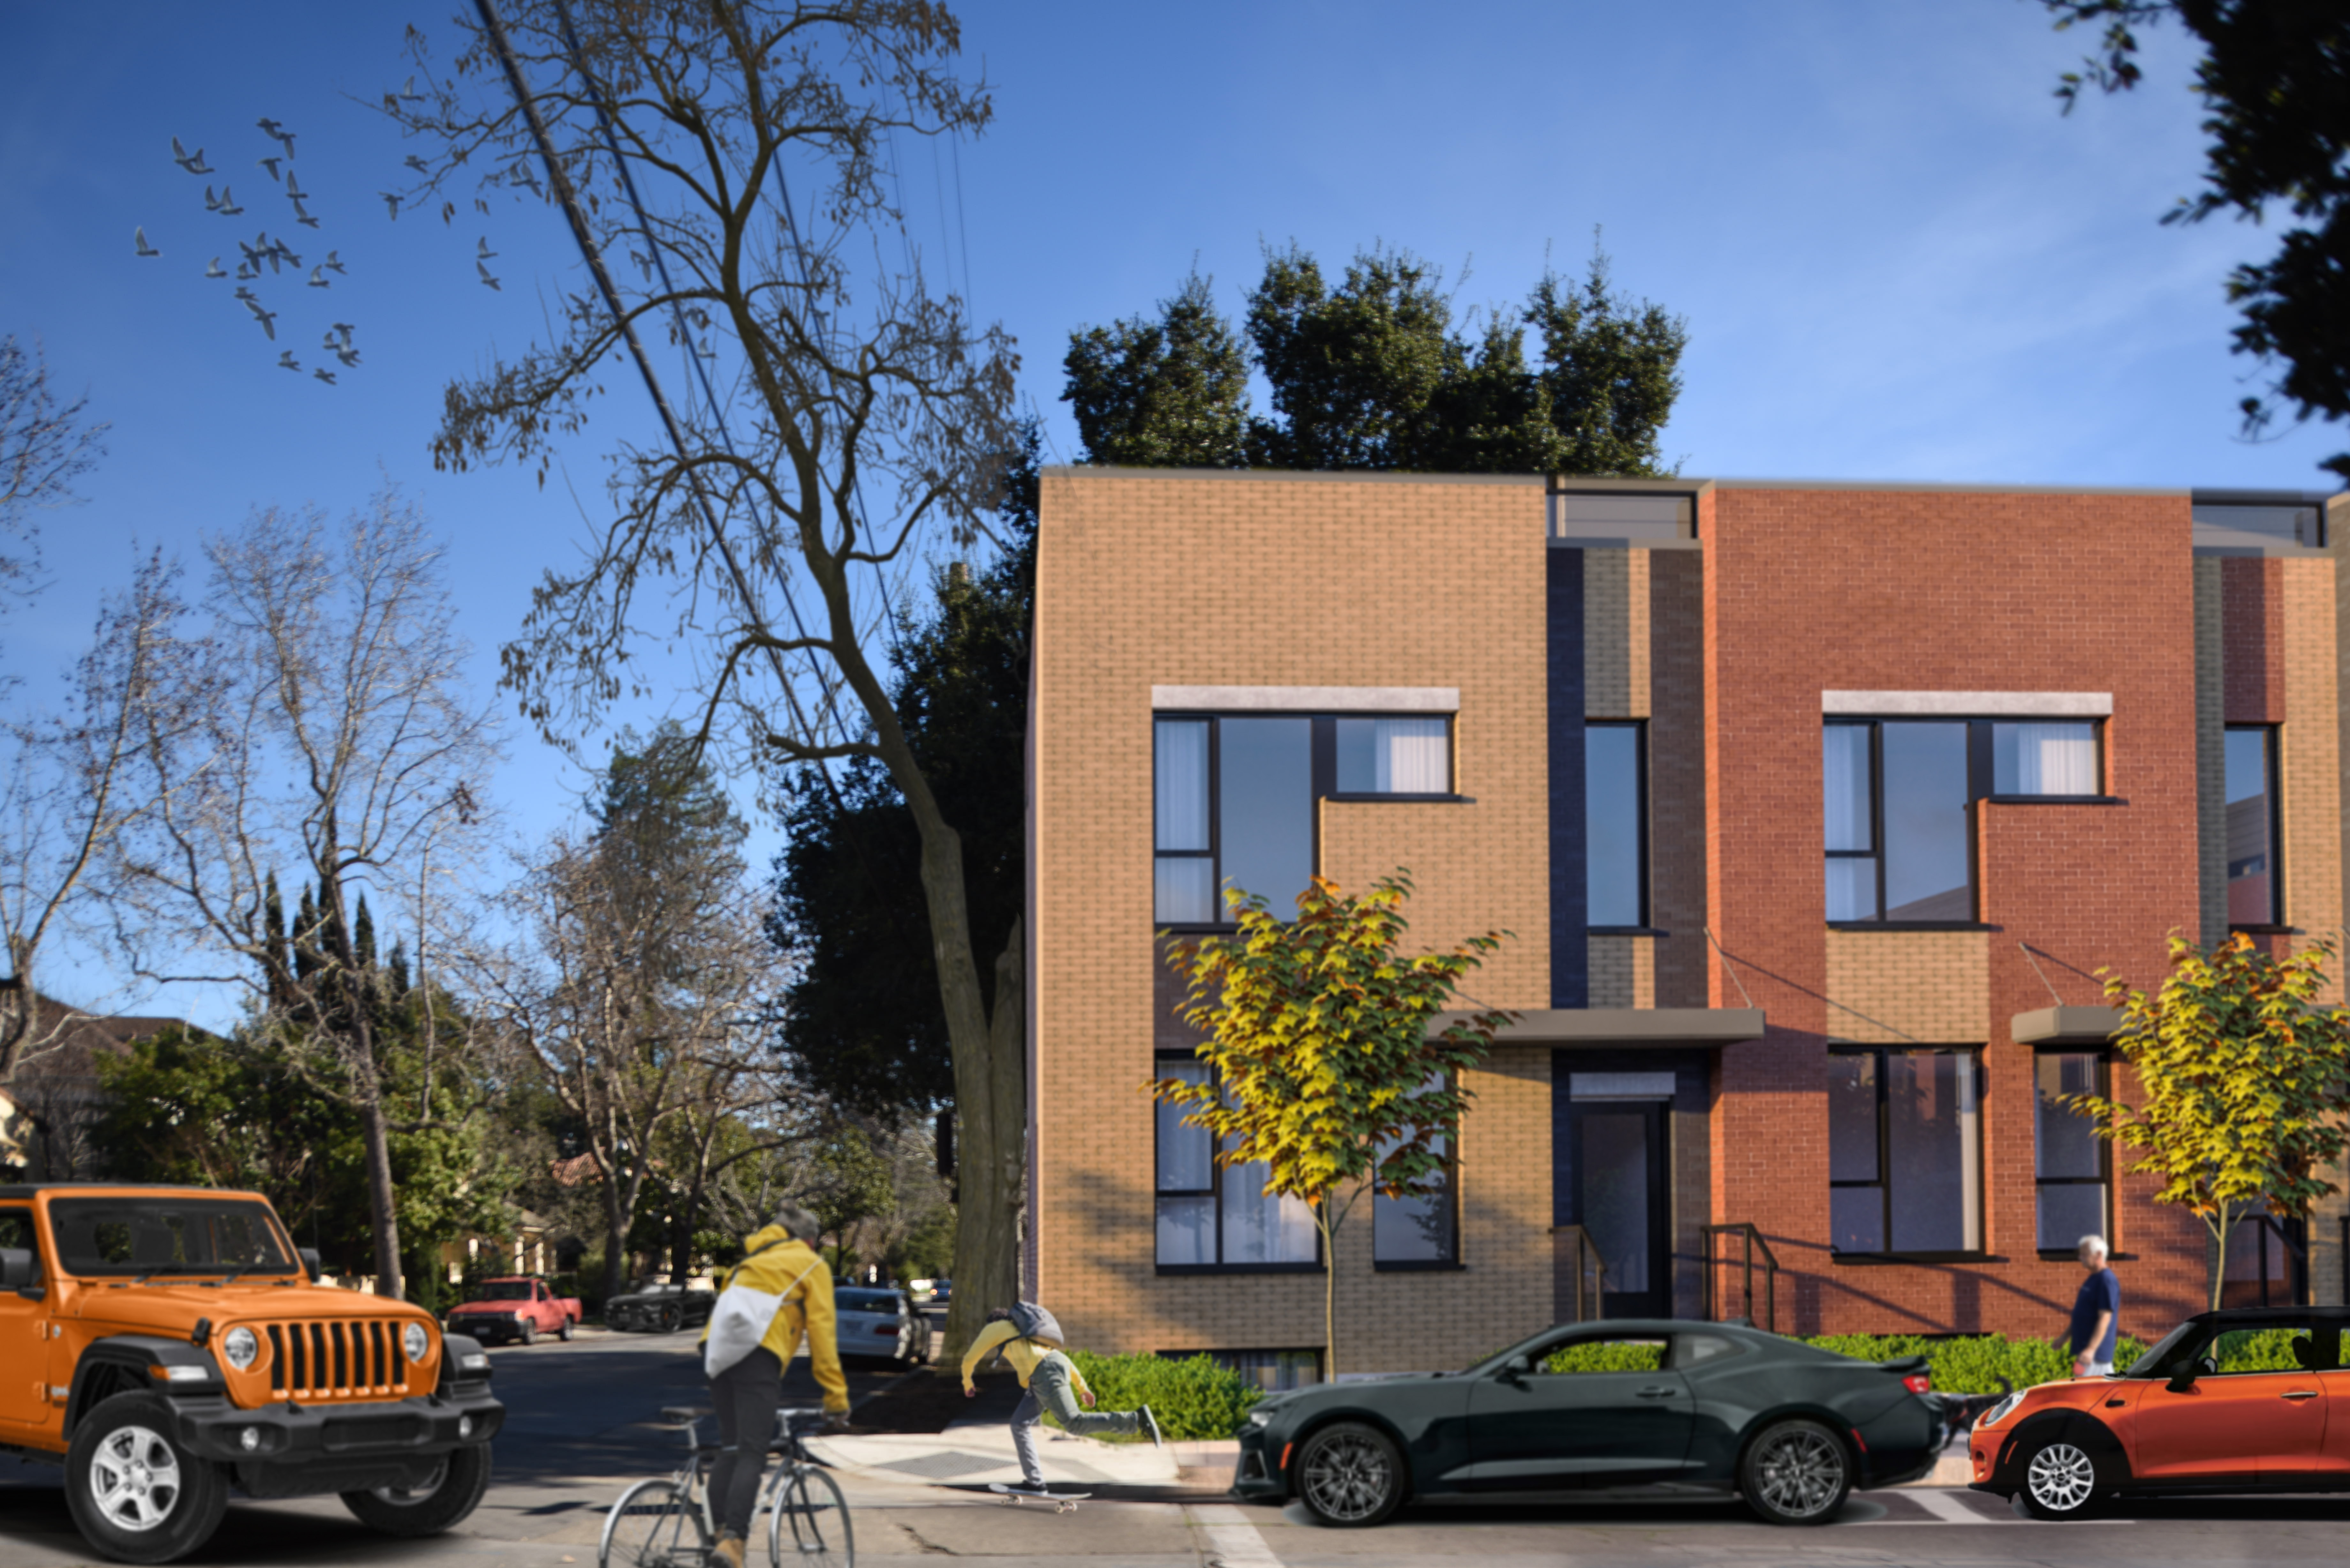
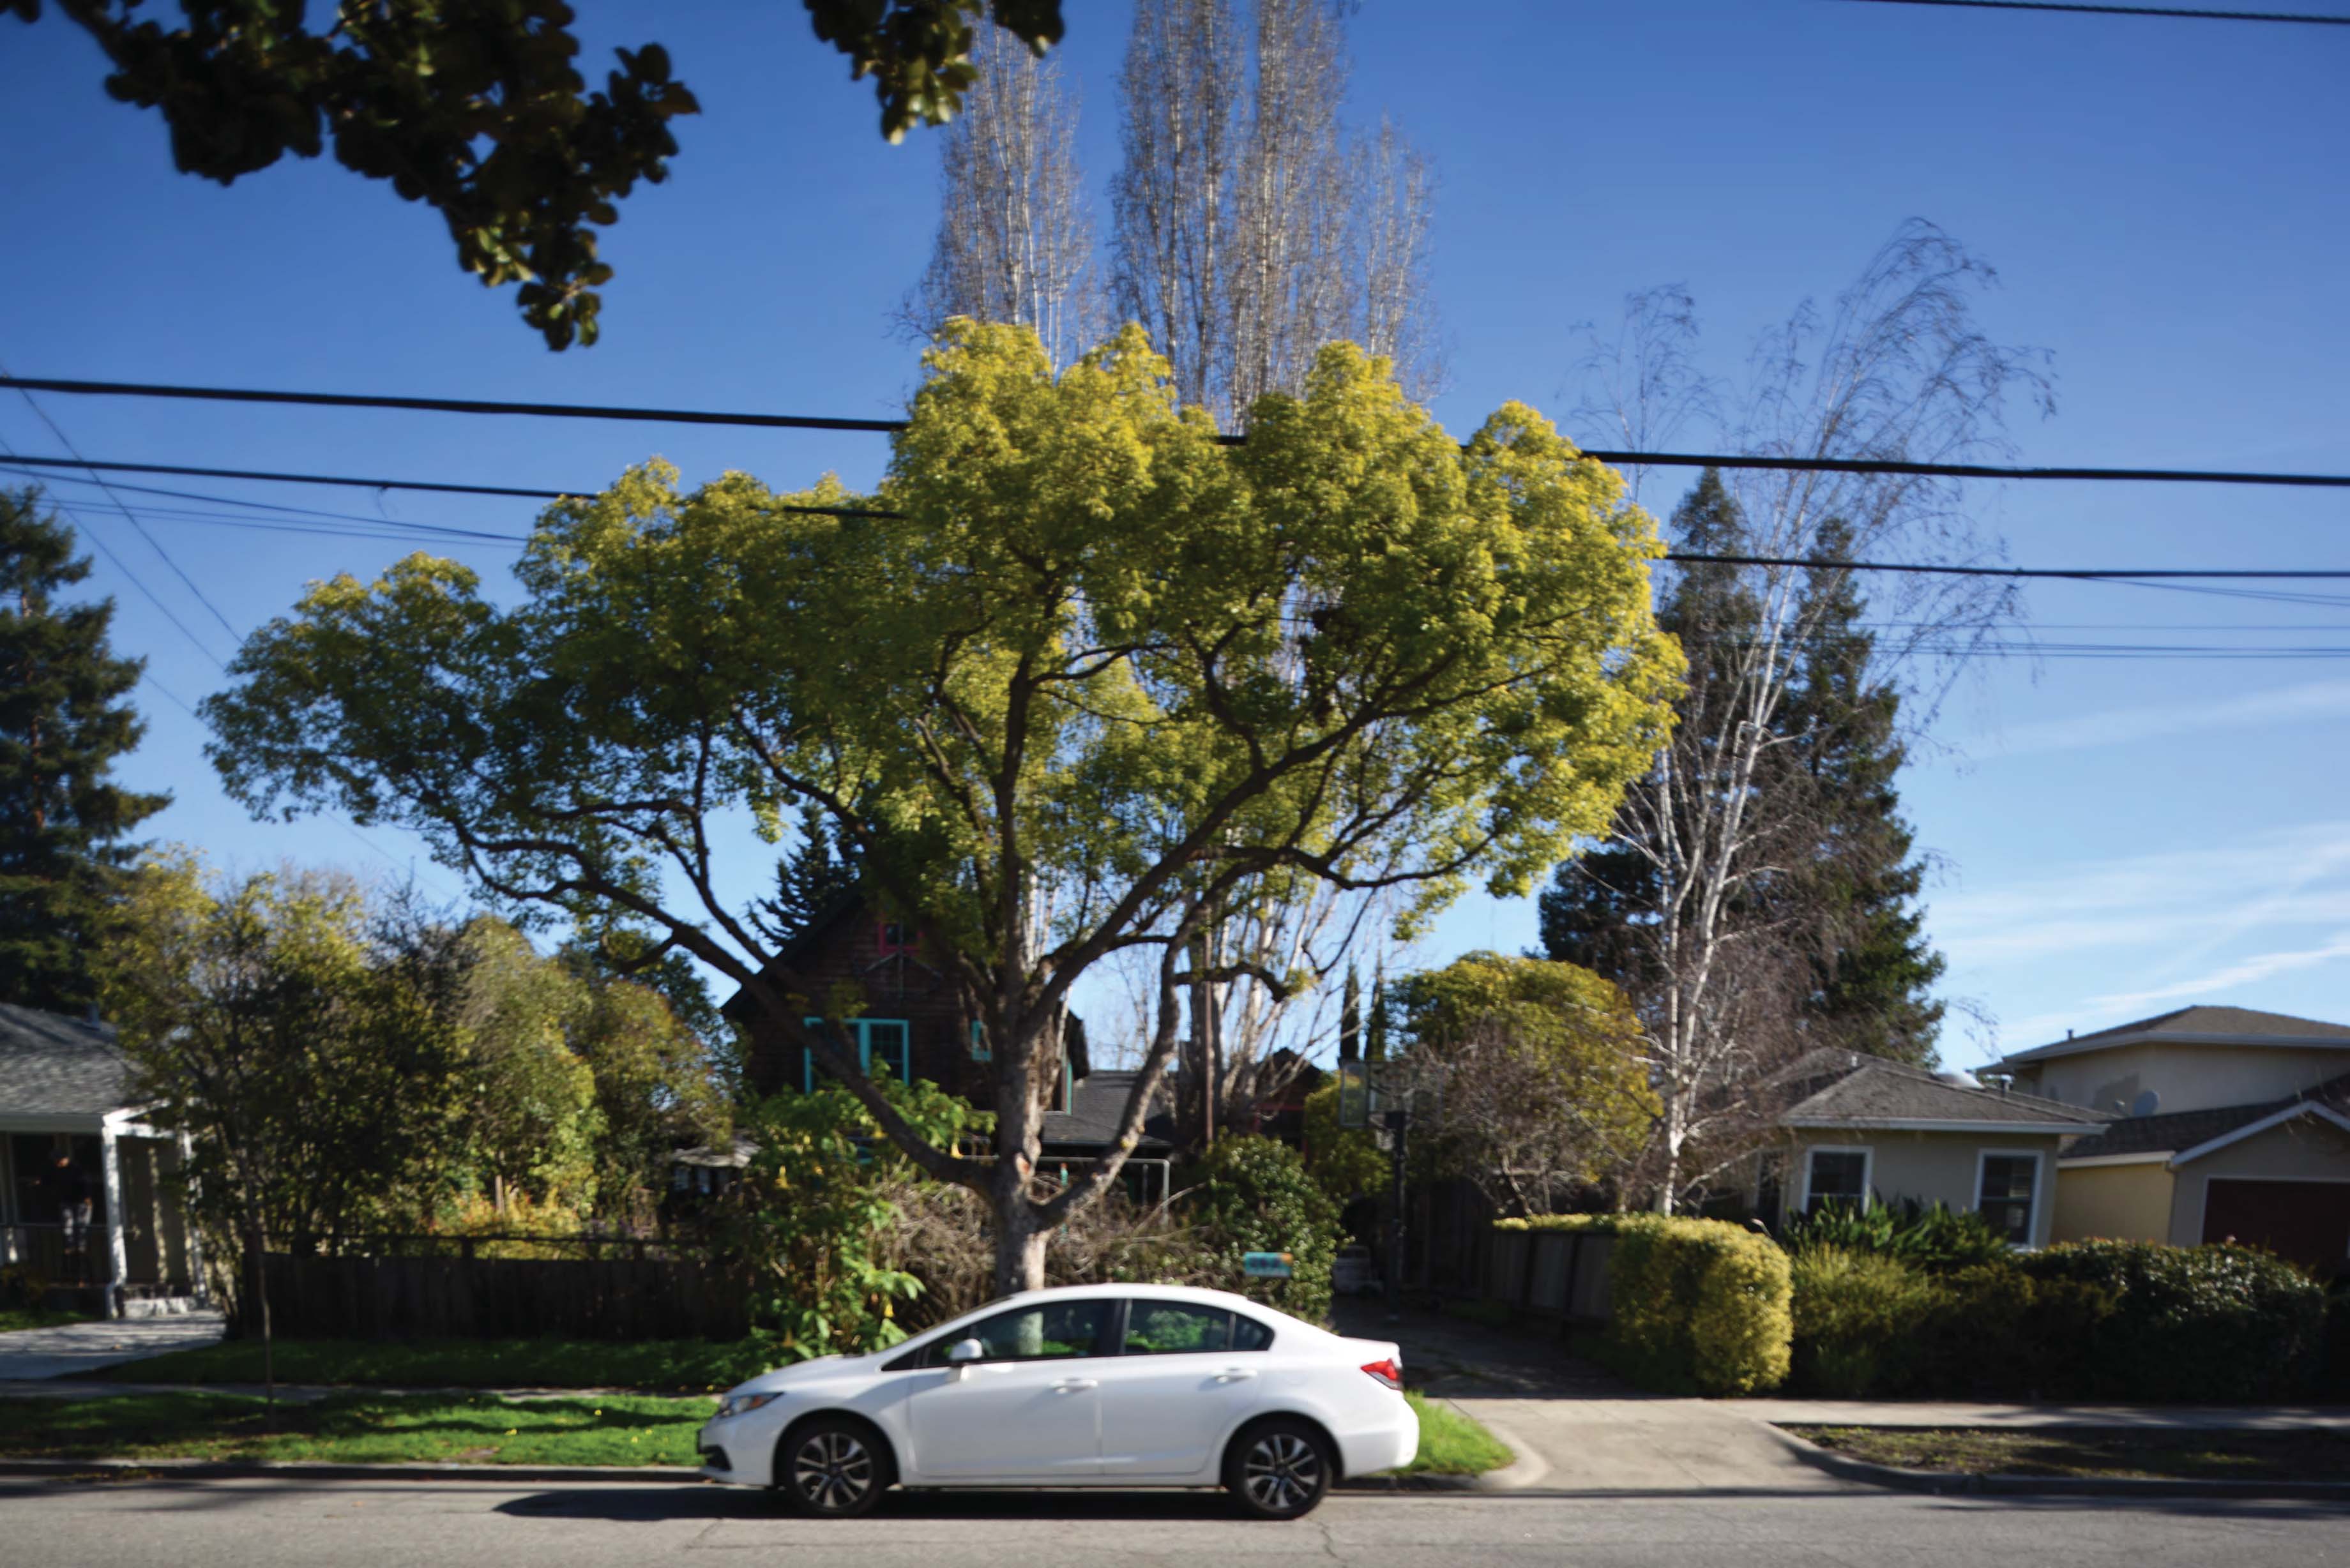
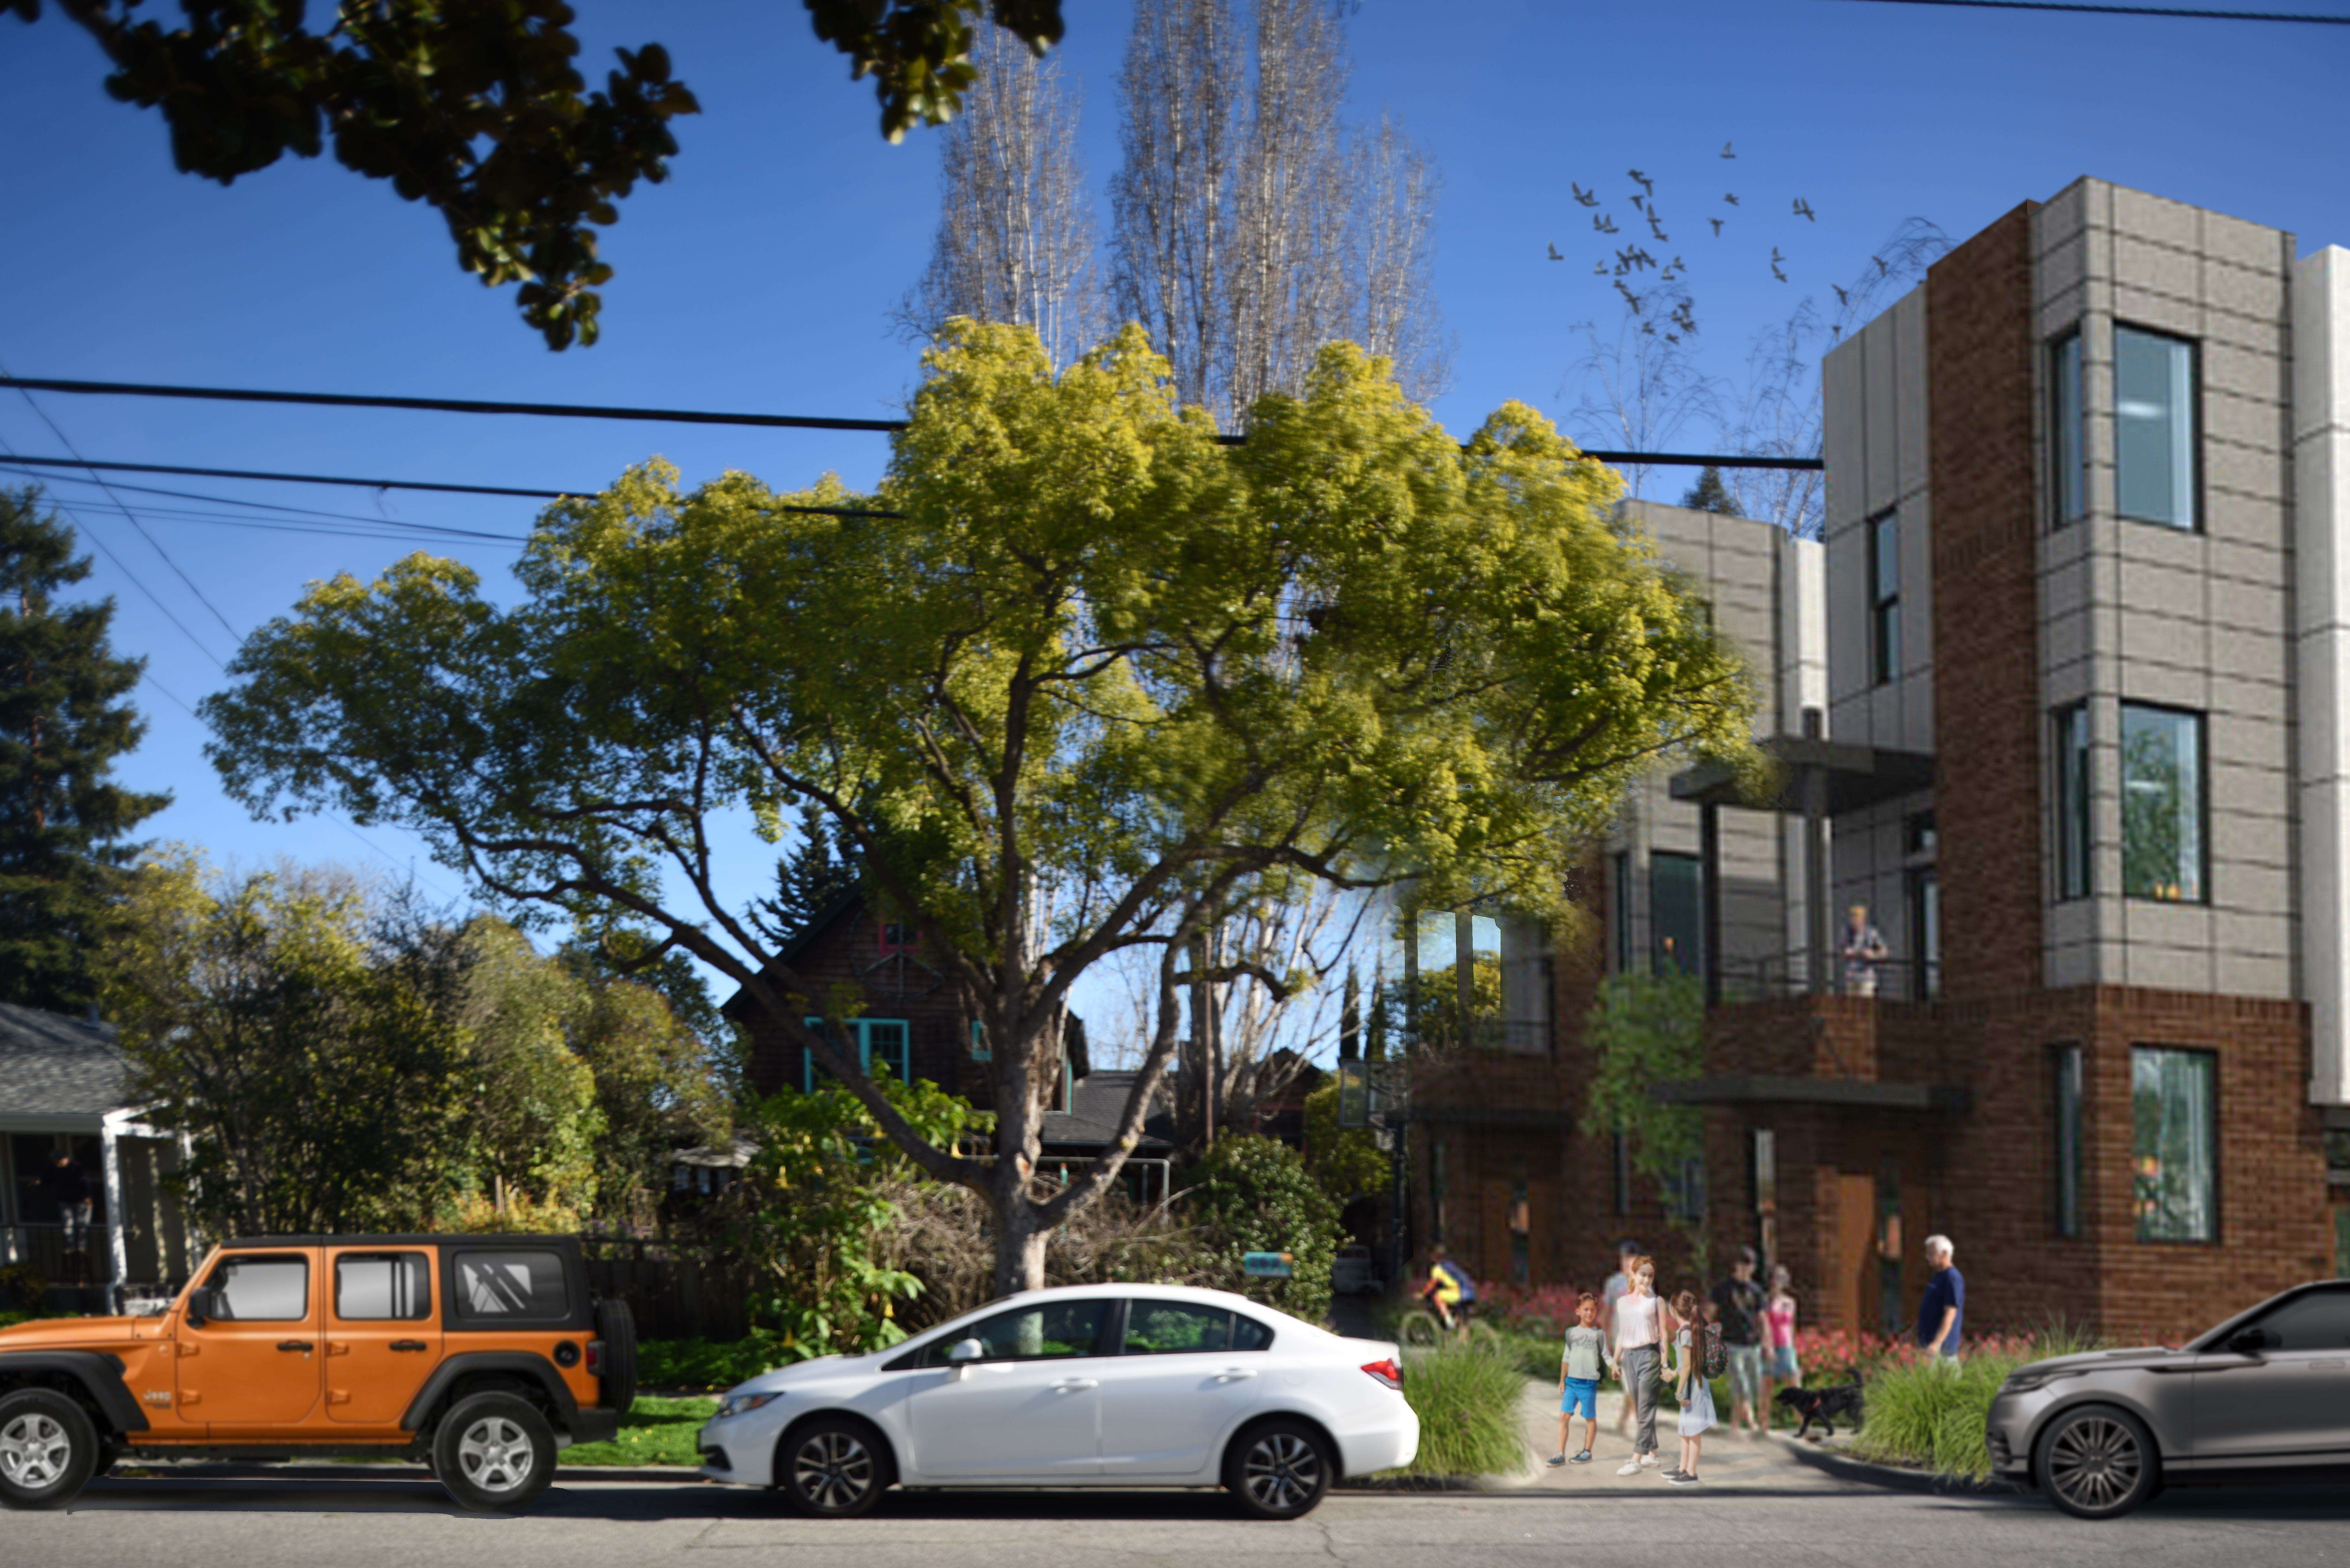
RENDERINGS
The following renderings show the possible impact of the bill for five locations in Palo Alto. These renderings show possible projects that take advantage of: exemptions from local controls on housing density; increased height maximums; higher Floor Area Ratios (FARs). These renderings demonstrate the possible encroachment on existing single-family neighborhoods and historic areas.
SITE 1: First Baptist Church – 305 N California Ave – In Transit Rich Area
Before and after rendering of First Baptist Church property at 305 N California Ave. The site is within a 1/4 mile of the California Avenue CalTrain station, meaning the site is eligible for multifamily development up to 55 feet tall, with a maximum FAR of 3.25. This could result in a development with up to approximately 150 studio or one-bedroom units on the 0.85 acre site.
SITE 2: 225 Addison Ave – In Transit Rich Area
Rendering showing smaller apartment buildings. The site is within a 1/2 mile of a major transit stop. Development could be 45 feet tall with a maximum FAR of 2.5. This would allow a smaller apartment building to be built with up to 10 units (about a 16,000 square foot building), or larger apartments to be built if multiple lots were replatted.
SITE 3: 4027 Scripps Ave – In Transit Rich Area
Rendering of properties along Scripps Ave. The area is within a 1/2 mile of a major transit stop. Development could be 45 feet tall with a maximum FAR of 2.5. If two lots were replatted into one parcel, this would allow an apartment building with about 55 studio or one-bedroom units (about 45,000 square feet).
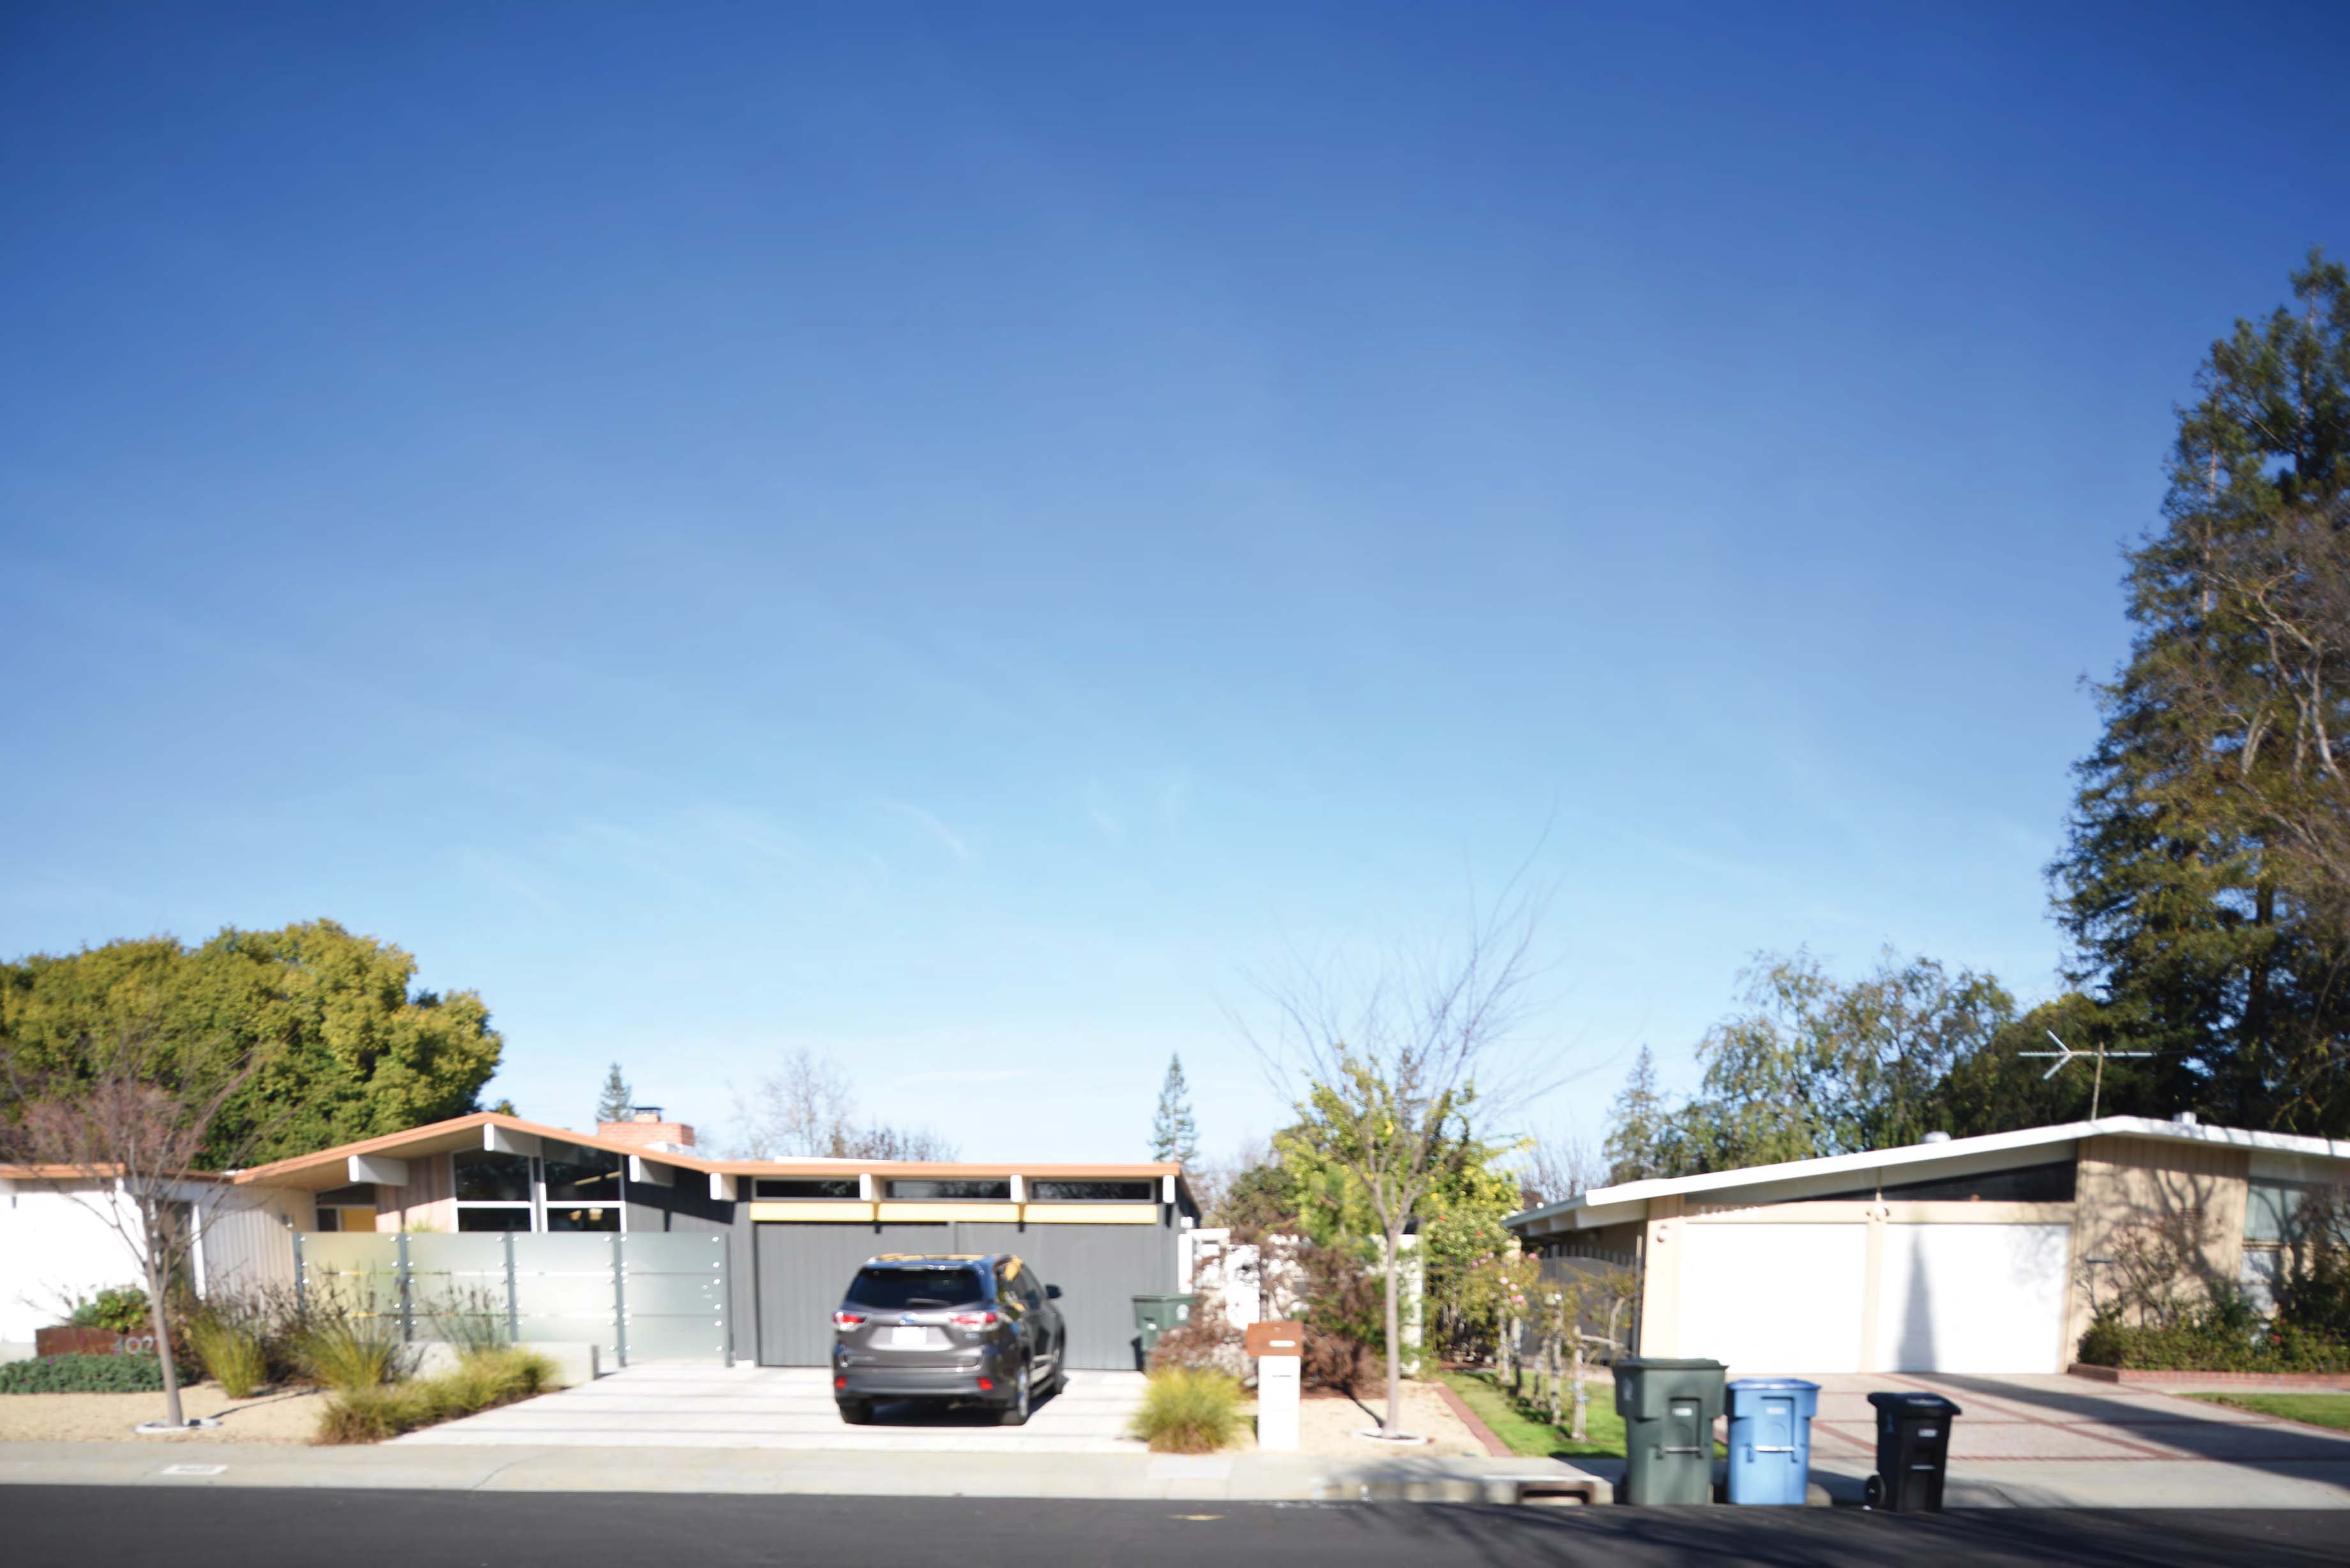
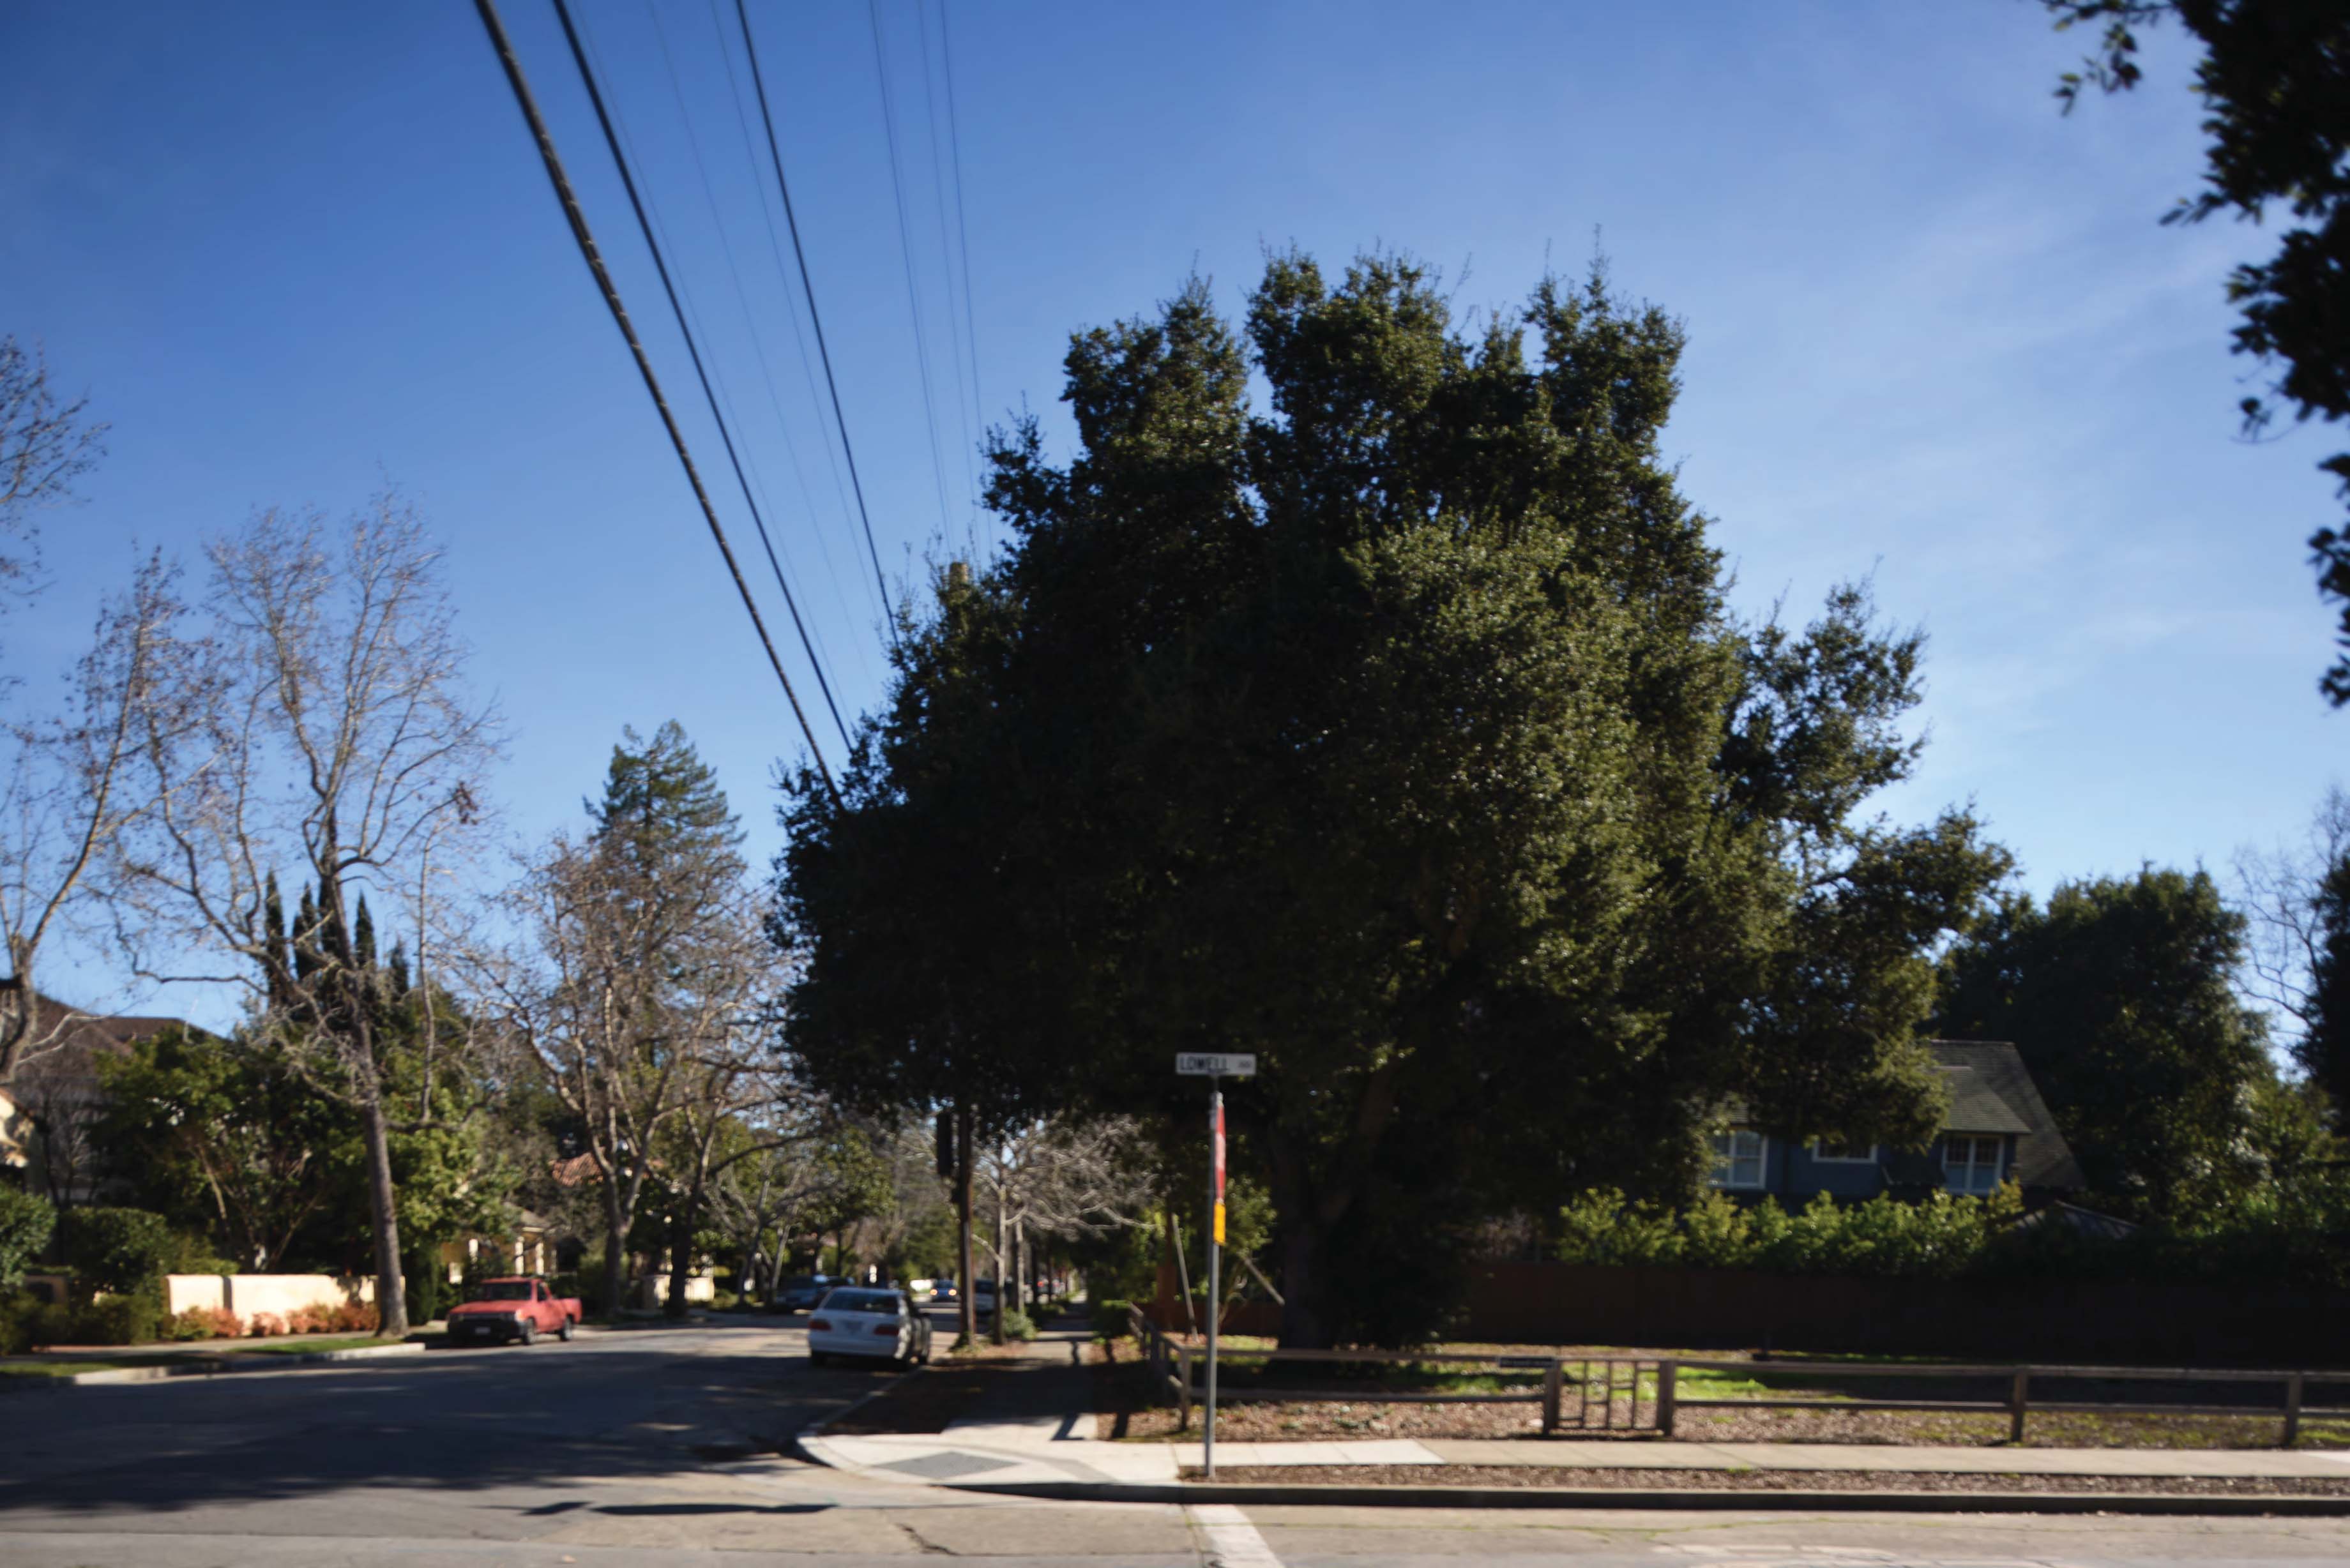
SITE 4: 307 Lowell Ave – In Jobs-Rich Area
Rendering of vacant lot at 307 Lowell Ave. The site is outside the ½ mile radius of major transit stops, but under SB-50, because all of Palo Alto is likely Jobs-Rich it will treated in the same manner as the High Quality Bus Corridor and therefore still eligible for waiver of both unit density limits. Given the size of the site and existing zoning, it could support a smaller townhouse development with approximately 10 units and a maximum height of 35 feet (to adjacent residential homes).
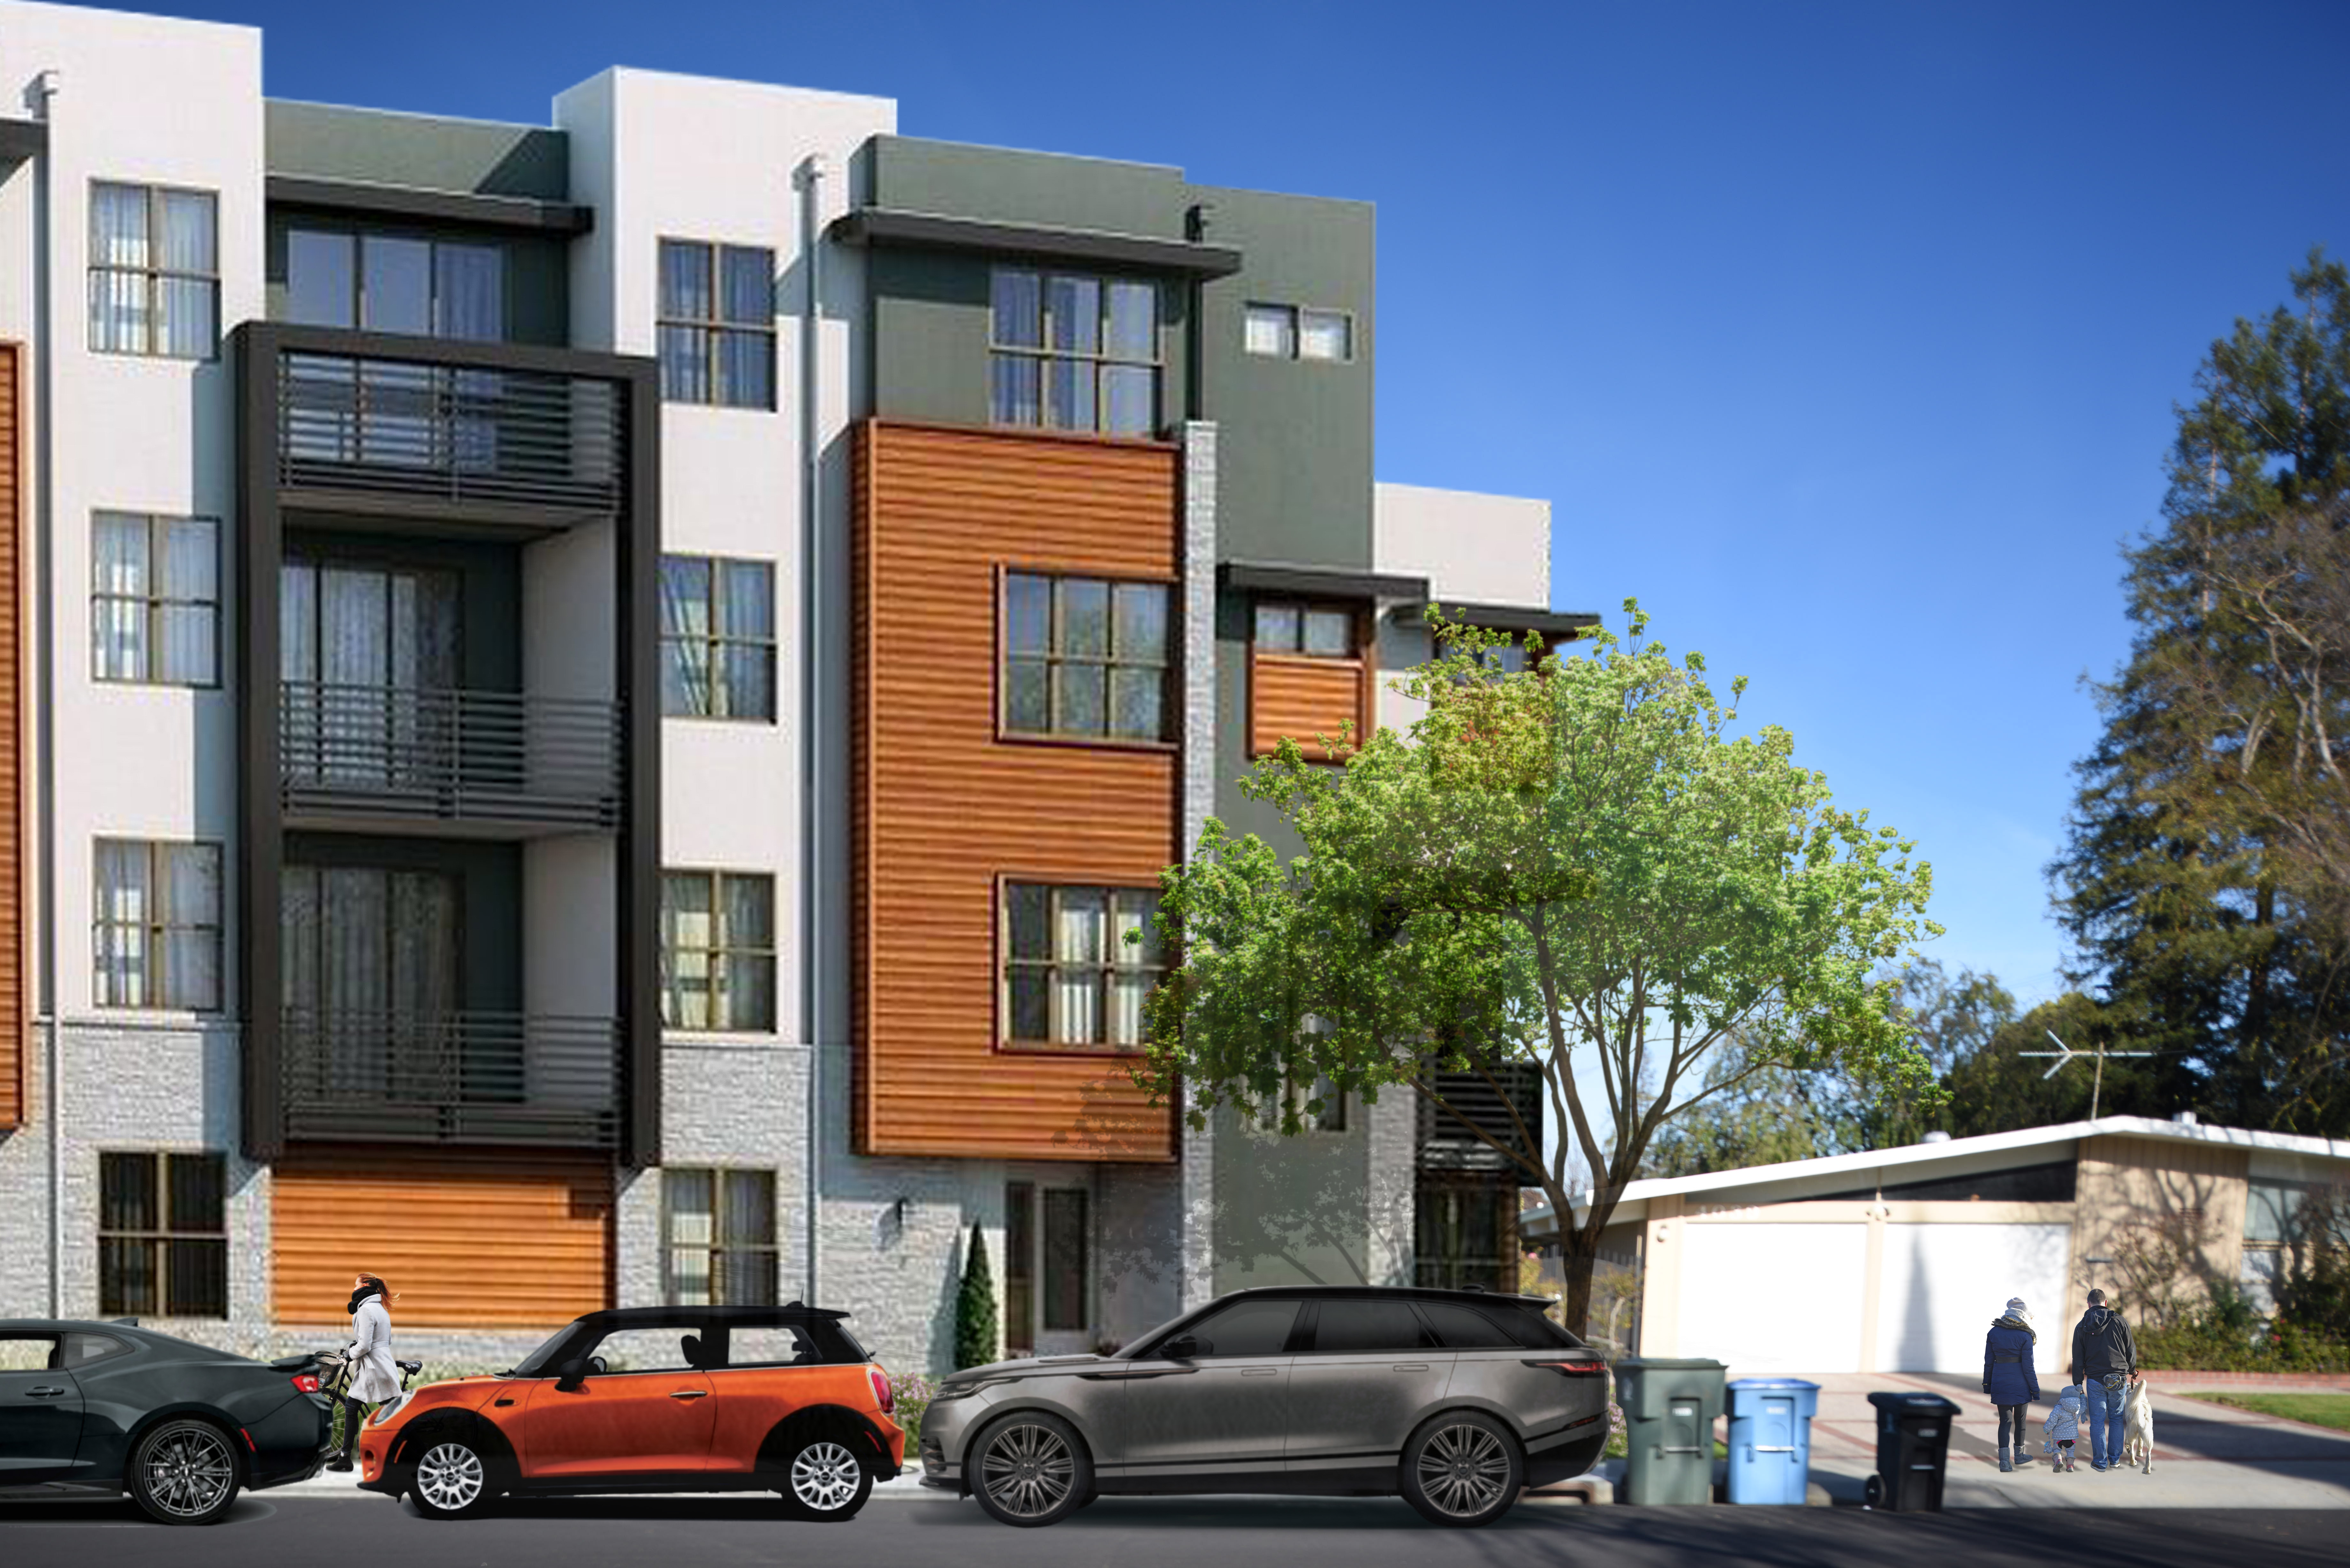
SITE 5: 243 Margarita – Along High Quality Bus Corridor
Rendering of 243 Margarita Ave with townhouse units. The site is in a High Quality Bus Corridor, meaning density controls are removed and additional incentives may be offered. Development could reach a maximum height of 30 feet tall under existing zoning, and would likely have a maximum FAR of 1. This would allow development of larger townhouse units, with approximately 8 units per lot.
NOTES & SOURCES
- The minimum number of affordable units is calculated based on the State’s Density Bonus Law or a locality’s Below Market Rate inclusionary requirements, whichever yields a greater number.
- Long term rentals within R1 zoning would be exempt from the density bonuses offered by SB-50, as the bill excludes sites if the parcel has housing already “occupied by tenants within the seven years preceding the date of the application.” Such long term rental parcels, under the current draft, would need to wait 7 years to be eligible for SB-50 incentives. Based on census derived data regarding housing characteristics in Palo Alto, it is estimated that rentals represent no more than 20% of single family homes, although rentals represent around 45% of all housing stock in Palo Alto.
- California Department of Education, Percent of Students Performing At or Above State Standards.
- Note the impacts for High Quality Corridor and Jobs Rich are the same under the current version of the Bill but since they are identified as separate zones in the Bill it is possible this may change.
- Hedges & Company Vehicle Ownership Data 2011-2018 for 5 Counties Santa Clara, San Mateo, Marin, Alameda, San Francisco County.
- UCLA, Institute of Transportation Studies: Falling Transit Ridership: California (2018) “Between 2000 and 2015, the share of households in the region with no vehicles fell by 30 percent, and the share of households with fewer vehicles than adults fell 14 percent.”
- Zip Code Profiles: Santa Clara County Public Health (2016) Number of vehicle-pedestrian injury collisions, 1 year, Number of vehicle-bicycle injuries, 1 year
- Santa Clara Valley Transportation Authority: VTA Annual Report (2017). VTA reports a 10% decline in ridership.
- Caltrain Annual Passenger Count Key Findings (2017) (2018) Top Ten Ridership Stations Percent Comparison 2016 to 2017 and 2017 to 2018. While Palo Alto retains its position as the station with the second highest Caltrain ridership after San Francisco, its share of ridership has plateaued. In absolute numbers Palo Alto’s weekday ridership declined between 2016-2017, but made a modest recovery of 124 as measured by Average Mid-Weekday Ridership (2017-2018). This on a base ridership of approx 7640 represents 1.6%.
- Caltrain Annual Passenger Count Key Findings (2017) (2018) Annual Count Morning Weekday Passenger Activity.
- Palo Alto City’s Comprehensive Plan 2018 estimates Palo Alto’s workforce to be over 100,000.
- Stanford 2018 General Use Permit Final EIR Part 2, Chapter 5, Table 5.15-44 Stanford Estimated Peak Hour Passenger Load pg 5.15-162
- American Community Survey 2013-2017 Table S0801 Commuting Characteristics by Sex, Worked outside place of Residence. In 2017, approximately 66% of Palo Alto workers aged 16 and above work outside their city of residence. Approximately 5% reported they used public transportation, a number consistent with Caltrain ridership.
- Caltrain Annual Passenger Count Key Findings (2018) Table 11. Fullest Trains Northbound Table 12 Fullest Trains Southbound.
- CalMod, Resources: Caltrain Electrification Project Fact Sheet Jan 2018. Although strangely, Caltrain separately published a different projection in their Q2 FY 2018 PCEP Quarterly Presentation (p 41 and 42) suggesting a 31% capacity increase could be expected by 2022. Stanford used the earlier cited 21% in their transit analysis for the GUP, so we decided if it’s good enough for Stanford, it’s good enough for us.
- Based on Hedges & Company Vehicle Ownership Data and student generation rates used by the City of Palo Alto